How to Annotate a Website for Bug Reports
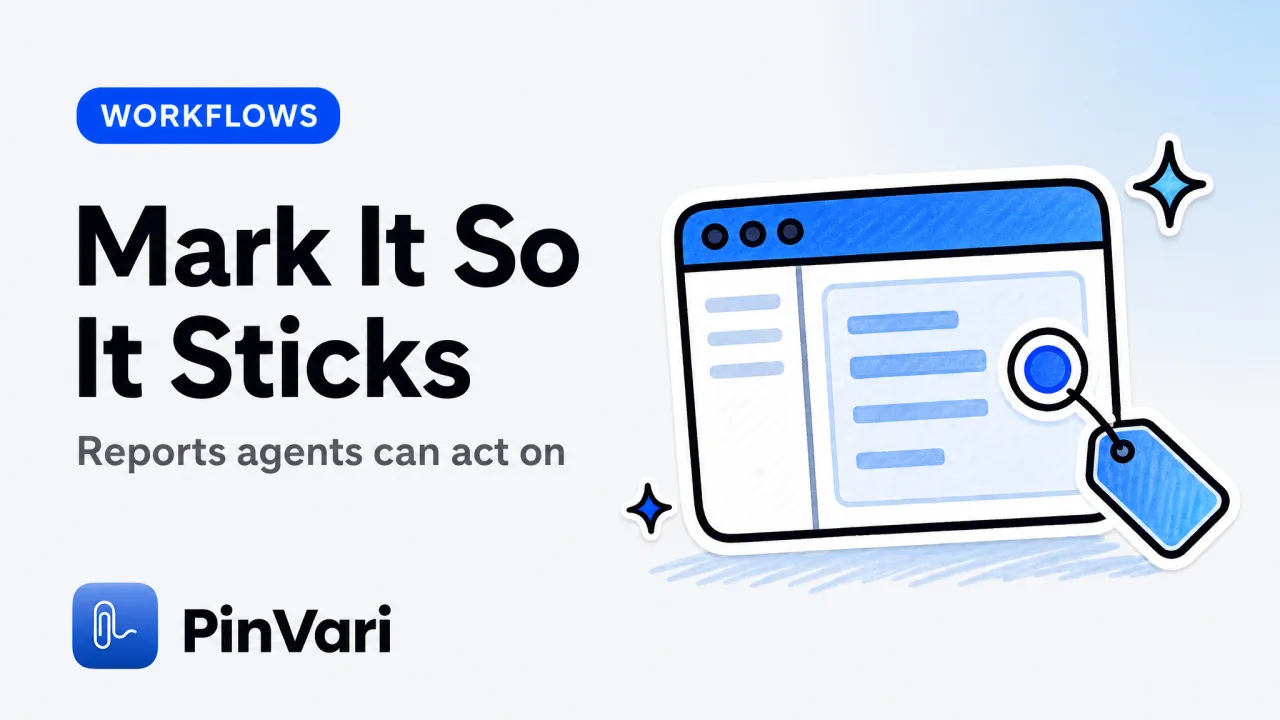
Knowing how to annotate a website for a bug report comes down to capturing four things: the exact element that is wrong, the page URL, the steps to reproduce, and what you expected versus what happened. The tools range from the browser's own screenshot markup to dedicated annotation apps, and the right one depends on whether you are pointing at a web page or a native app the browser cannot see.
Most advice on how to annotate a website stops at "draw an arrow and add a comment," which is exactly why so many reports bounce back. A red circle tells a developer where to look, not which named control to change, and that missing piece is what turns a two-minute fix into a three-round conversation.
How to annotate a website that developers can act on
An annotation is only as good as the context stapled to it. A screenshot with an arrow says "somewhere here," while a report a developer can act on says "this named element, on this URL, after these steps, did the wrong thing."
Start with the target. Circle or box the single element in question, not the whole section, so there is no ambiguity about which control you mean.
The difference between a good annotation and a noisy one is specificity. A comment that says "the layout is broken here" restarts the investigation from zero, while "the header Save button overlaps the search field below 900 pixels wide" hands the developer a hypothesis to test.
Precision in the annotation is precision in the fix.
Then attach the four fields that stop a report from bouncing:
- The element, named if you can, not just its location.
- The page URL, the real one, so it opens to the exact state.
- Steps to reproduce, the shortest path that triggers it.
- Expected versus actual, in one line each.
Name the element, do not just point at it. "The Save button in the header" survives a redesign that moves it; "the button at 480, 210" does not. A named control is the single biggest upgrade you can make to any annotation.
If you want a template that already carries these fields, our bug report example lays out a structure developers and AI agents both read cleanly.
What tools let you annotate a website?
Three families, and they solve different halves of the problem. Browser extensions mark up live pages, screenshot apps mark up static images, and design-review tools thread comments for teams.
Here is the honest side-by-side for a QA engineer choosing one.
Skip the wide grid. Read each option as a card.
#
Browser annotation extension
Marks live pages: Yes
Native apps and IDEs: No
Voice input: No
Names the element: No
#
Screenshot markup app
Marks live pages: Static image only
Native apps and IDEs: Yes, as an image
Voice input: No
Names the element: No
#
Design-review platform
Marks live pages: Yes, web
Native apps and IDEs: No
Voice input: No
Names the element: No
#
Point-and-speak (native)
Marks live pages: Yes
Native apps and IDEs: Yes
Voice input: Yes
Names the element: Yes
Browser extensions like the popular free ones are excellent at capturing a web page with console logs attached, and they are the right pick when the bug lives in Chrome. Their hard limit is scope: they cannot capture a native macOS window, an Electron app, or your editor.
That limit is why teams testing desktop or hybrid apps outgrow them. The Jam.dev alternative for native Mac apps discussion and our broader design review software roundup both cover where browser-only capture runs out of road.
How to annotate a website versus a native app
The method should not change when the surface does, but with most tools it does. Learning how to annotate a website with a browser extension teaches you a workflow that breaks the moment you open an Electron build, a desktop client, or the IDE that renders your component.
That split forces QA teams into two tools and two habits: one for Chrome, one for everything else. Each produces reports in a different shape, and neither names the element in a way an AI agent can act on.
A capture layer that reads the operating system, rather than the browser, collapses the split. On macOS, the accessibility tree exposes labeled controls in Safari, Chrome, a native SwiftUI app, and an Electron window alike, so the same gesture annotates all of them.
If you test both web and desktop builds, pick a capture method that does not care which surface you are on. One consistent report shape across web and native apps is worth more than the deepest console-log capture that only works in Chrome.
The practical payoff is a single report format. Whether the bug is in a marketing page or a packaged desktop app, the annotation carries the same fields, the named element, the URL or window, the steps, and the expectation, so triage does not slow down at the boundary between web and native.
Why do annotated bug reports still get bounced?
Because the annotation shows where without saying what. A circle around a button leaves the developer to identify the element, guess the state, and hope the URL in the screenshot still resolves.
For an AI coding agent, the gap is worse. Hand an agent a marked-up screenshot and it still has to figure out which of five similar buttons you circled, and it routinely edits the wrong one.
The report needs the element's identity, its role and label, not a pixel region. A name is reproducible; a coordinate is not. That single difference is what separates a report that gets fixed from one that generates questions.
The most common reason a visual bug report gets kicked back is a missing element name and a missing exact URL. An arrow is not a specification, and an AI agent cannot infer the target from a picture.
How do you annotate a website and name the element automatically?
You point at it and speak, and let software resolve the name. PinVari is a native macOS app where you hold ⌥⌘A, circle any element on a web page or in a native app, and say what is wrong, and it turns the gesture plus the sentence into a precise, named report.
It screenshots the region, transcribes your voice on-device, and resolves the exact named accessibility element you circled, including its role, label, and frame, with a confidence score attached. On a web page it reads the browser's real URL through the accessibility AXWebArea, so the report opens to the exact state, and when a surface has no accessibility data, like a canvas, it falls back to on-device Vision OCR rather than guessing.
Then it files a resolved, named report straight to Linear, GitHub, or Slack, hands it to your own AI coding agent over a local server, or drops it on a shareable page. The workflow for filing to a tracker directly is spelled out in point-and-speak bug reports for Linear and GitHub.
Because it reads the macOS Accessibility API, it works on any Mac window, not just Chrome. That is the difference between annotating a website and annotating everything you build, native apps and IDEs included.
The naming is the part that matters for QA. When "this" binds to a labeled control with a confidence score, and the report ships with the URL and a cropped screenshot as evidence, a developer or an agent acts on a specification, not a hint.
Below a confidence threshold it asks rather than silently guessing, so you never file a wrong element by accident.
It runs on-device with no API keys and nothing uploaded by default, and it ships as a notarized DMG for macOS 14 and up on Apple Silicon and Intel. It is a one-time $39 launch license rather than the per-seat monthly pricing common in website feedback tools; the pricing page has the breakdown.
If you want the conceptual grounding first, our overview of website annotation explains where the practice came from and where it is going.
FAQ
#
How do you annotate a website for a bug report?
Circle the exact element that is wrong, capture the page URL, write the shortest steps to reproduce, and state what you expected versus what happened. Attach a screenshot as evidence, and name the element rather than pointing at a location so the report survives layout changes.
#
What is the best tool to annotate a website?
It depends on scope. Browser extensions are great for web-only pages with console logs, design-review platforms suit team threads, and point-and-speak tools go further by naming the element and working on native macOS apps, not just Chrome.
#
Can you annotate a website without a browser extension?
Yes. A native macOS tool can capture any window, including web pages, native apps, and editors, by reading the accessibility tree directly.
That avoids the browser-only limit of most extensions and still reads the page URL.
#
How do AI coding agents use website annotations?
An agent needs the element's identity, not a pixel location, to edit the right control. Annotations that resolve the named accessibility element let an agent act on a labeled target, which is why a name beats an arrow on a screenshot.
#
Why do my website bug reports keep getting rejected?
Usually a missing element name, a missing exact URL, or absent reproduction steps. Reports that name the control and open to the exact state get fixed faster because the developer does not have to reconstruct what you saw.
#
Can I annotate a website with my voice?
Yes, with a point-and-speak tool you hold a hotkey, circle the element, and describe the problem out loud. The tool transcribes on-device and binds words like "this" to the element you pointed at, producing a named report without typing.
Hand your agent the exact element
PinVari resolves what you point at into a named, executable instruction — on-device, no keys, your own agent. One click inside PinVari connects Claude Code, Cursor, VS Code or Codex — or paste one CLI line from pinvari.com/connect.
PinVari → Connect → your agent (one click)Get PinVari — $39 →