Website Annotation: Tools for Visual Feedback & QA
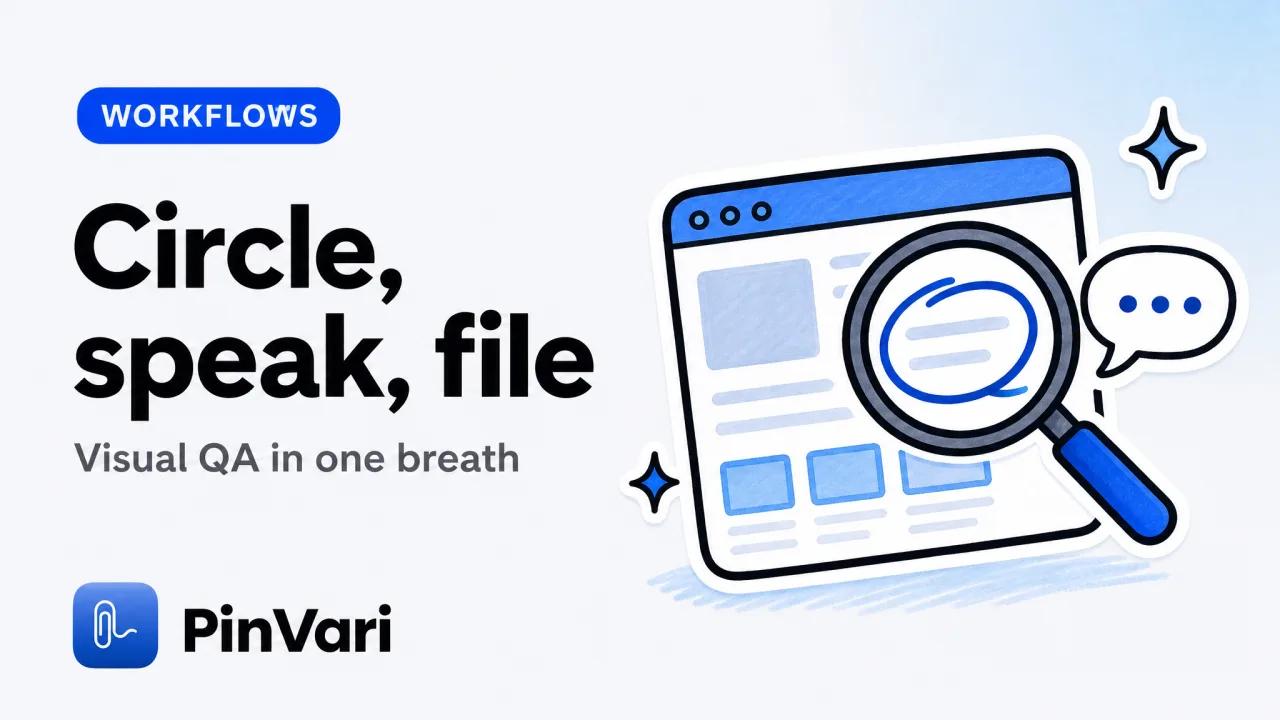
Website annotation is marking specific UI elements on a live page or app with visual feedback so developers know exactly what to fix. The best tools go past arrows on a pixel grid: they capture the named accessibility element under your pointer.
That means role, label, and frame — then a screenshot, and a reproducible instruction for the person or AI coding agent who owns the fix. Most guides stop at browser extensions that draw on a capture.
The real win is resolving the element by name so reports are executable, not a guessing game.
Why do QA teams use website annotation tools?
Bug reports bounce when they say "the button doesn't work." They land when they name #checkout-submit and the 403.
Annotation tools capture the exact element — role, label, frame — plus the screenshot and, in browser tools, console and network state. Developers reproduce the issue in one try.
Agents can read the element path and apply the fix without a clarifying round.
Traditional QA hops between a screen-capture app, a text editor for steps, and Slack or Linear. Annotation collapses that: point at the broken thing, speak or type the instruction, press Enter.
The ticket includes a crop of the region you marked, the element's path, and the URL.
The annotation must name the element (accessibility API or DOM inspector) to be executable. A circle over pixels with "fix this" forces a guess among overlapping <div>s.
What are the main types of annotation tools?
Skip the wide comparison grid. Read each type as a card.
Browser extensions (Jam, Marker.io)
Type: Chromium or Firefox tab capture.
Capture: Screenshot plus console, network, and a DOM snapshot.
Resolution: DOM path. Not a native AX name.
Price / best for: Free to about $39/mo. Web apps and agencies billing clients.
Jam.dev is the default because it's free and auto-captures console errors and network requests. Limitation: it cannot see native macOS apps (Xcode, Figma desktop, Slack native) or Electron windows where DevTools aren't open.
Native screenshot apps (CleanShot X)
Type: Whole macOS desktop pixels.
Capture: PNG with arrows and text.
Resolution: None. Pixels only.
Price / best for: About $29 one-time. Design reviews, not structured bugs.
CleanShot X and Screenshot.app capture anything on screen. They know nothing about what they captured.
The developer OCR's your arrow or counts pixels.
Point-and-speak + AX (PinVari)
Type: macOS desktop and browsers.
Capture: Cropped screenshot, on-device transcript, pointer trail.
Resolution: Named AX element plus a confidence score and circled-vs-dwelled provenance.
Price / best for: $39 one-time launch. Native apps, Electron, agent-driven QA.
Hold ⌥⌘A, circle the broken button, say "this should be disabled until the form validates." It transcribes on-device, resolves AXButton "Submit" with a frame, and files the instruction to your agent or Linear.
Screen recorders (Loom, ScreenFlow)
Type: Full screen or window video.
Capture: A timeline, not a structured report.
Resolution: None.
Price / best for: Free to about $15/mo. Async explainers.
On a web app in Chrome, pair Jam (console logs) with Chrome's accessibility-tree inspector so the element has a real role and label before you file.
How do you annotate on a website (step by step)?
Browser-extension method (Jam.dev)
- Install the Jam Chrome extension (free).
- Open the page and reproduce the bug.
- Click the Jam icon. It captures console, network, DOM, browser version, and viewport.
- Draw on the screenshot. Type steps to reproduce.
- Create the Jam and paste the link into Slack, Linear, or GitHub.
Strength: technical context developers need. Limit: Chromium only — not Safari, not native apps, not Electron without DevTools.
Point-and-speak method (PinVari)
- Install PinVari (macOS 14+, $39 one-time). Grant Accessibility and Screen Recording.
- Open the broken UI — browser, native app, or Electron.
- Press ⌥⌘A. A lime trail follows the pointer.
- Circle or point at the element. Hover about 0.2s to resolve without drawing.
- Speak while marking: "this button should show a loading spinner when clicked."
- Press ⏎. It screenshots, transcribes on-device, and resolves the exact named accessibility element with a confidence score. Below 0.8, it asks.
- The capture lands in the notch island. Send it to a connected agent or file to Linear or Slack.
The agent gets pinvari_next_instruction: element path, transcript, crop. It reads the tree and writes the fix.
Electron apps build their AX tree lazily. PinVari sets AXManualAccessibility and retries about 150ms. Circle too fast and you get a bare AXGroup. Hover an extra half-second.
What's the difference between annotating for developers vs AI agents?
For human developers
Include numbered steps from a known state. One sentence each for expected vs actual.
Add a circled screenshot with the name or selector visible. Add environment: browser, OS, viewport, role.
A good bug report example names the control, the 403, and the viewport. It does not say "export is broken."
For AI coding agents
The agent cannot click around your UI. It needs the plain imperative sentence plus an exact path (AX role+label+frame, or a CSS selector).
Crop the screenshot to the region. A full 4K desktop wastes tokens on wallpaper.
Add provenance: circled (higher confidence) or dwelled. Include the score if you have one.
A PinVari tool call looks like this:
{
  "element": {
    "role": "AXButton",
    "label": "Submit Order",
    "frame": {"x": 420, "y": 680, "width": 120, "height": 44},
    "parent_chain": ["AXWindow 'Checkout'", "AXGroup 'Form Container'"]
  },
  "instruction": "disable this button until all required fields are filled",
  "confidence": 0.95,
  "provenance": "circled"
}
The agent finds the control, checks validation, and binds disabled. One shot.
Which tools work on native macOS apps (not just browsers)?
Browser-only tools inject JavaScript into the DOM. They cannot annotate native macOS apps or Electron windows without DevTools.
They also fail on canvas UIs. The DOM is one <canvas> with no children.
PinVari captures any on-screen UI via AXUIElementCopyElementAtPosition. It resolves AppKit and SwiftUI, forces Electron's tree with AXManualAccessibility, and reads the real URL from AXWebArea.
On AX-blind surfaces it falls back to on-device Vision OCR and returns text plus boxes.
CleanShot X captures anything and provides zero names. Pair it with Accessibility Inspector if you need labels.
Chrome and Firefox web apps
Jam: yes, plus console logs.
CleanShot X: pixels only.
PinVari: named element plus URL.
Safari tabs
Jam: no.
CleanShot X: pixels only.
PinVari: named element plus URL.
Native macOS apps
Jam: no.
CleanShot X: pixels only.
PinVari: named AX element.
Electron (VS Code, Slack desktop)
Jam: only if DevTools are open.
CleanShot X: pixels only.
PinVari: AX tree plus retry.
Canvas UIs (Figma surface, games)
Jam: no.
CleanShot X: pixels only.
PinVari: OCR fallback.
How do annotation tools connect to AI coding agents?
Browser extensions export a link. You paste it into chat.
The agent sees a screenshot and logs as an image plus text.
It cannot programmatically read the element's name. You still type the id.
MCP-connected tools install a local server. PinVari's connector lives at ~/.pinvari/mcp/pinvari-mcp.
Connect in-app (PinVari → Connect) or:
claude mcp add --scope user pinvari -- "$HOME/.pinvari/mcp/pinvari-mcp"The agent then has pinvari_next_instruction and pinvari_mark_done.
You circle a filter and speak. In the editor you say "fix the next PinVari issue." Claude reads AXPopUpButton "Category Filter" and edits the CSS.
It marks the capture done.
The MCP server talks to PinVari on 127.0.0.1:3402. The app must be running. Local only — no keys, nothing uploaded by default.
What should you look for in an annotation tool (QA checklist)?
- Element resolution: name and role, or just pixels?
- Capture scope: browser-only, or native plus Electron?
- Voice: speak while pointing, or type after?
- Confidence: does it admit a bare unlabeled group?
- Integration: tracker, or MCP into your agent?
- Privacy: on-device STT/OCR, or a cloud API?
- Price: one-time or subscription? Team seats?
For web-only QA, Jam is the default. For native plus agents, PinVari resolves named elements over MCP.
For visual polish with no code, CleanShot X or Marker.io.
FAQ
What is the best annotation tool for websites?
Jam.dev is the best free browser tool — console, network, DOM in Chromium. For native macOS apps and agents, PinVari resolves named AX elements and connects over MCP.
Can you annotate websites in Safari?
Jam is Chromium only. PinVari captures Safari via the macOS Accessibility API: AXWebArea URL, page text, and the element under the pointer, with OCR on canvas.
How do AI agents use website annotations?
Agents read them as tool-call inputs. pinvari_next_instruction returns path, spoken instruction, and a crop.
The agent locates the control and applies the fix.
What's the difference between annotation and screenshot tools?
Screenshot tools capture pixels. Annotation tools resolve the named UI element so the report says which button, not only where it sat.
Do annotation tools work on Electron apps like VS Code?
Browser extensions do not inject into native Electron windows. PinVari sets AXManualAccessibility and retries until the tree populates, then returns role, label, and frame.
Can you annotate multiple elements in one capture?
PinVari lets you circle several regions in one breath. Each mark gets its own word bucket; "this" binds to the pointer at the instant you said it.
Browser tools usually one marked region per Jam.
Hand your agent the exact element
PinVari resolves what you point at into a named, executable instruction — on-device, no keys, your own agent. One click inside PinVari connects Claude Code, Cursor, VS Code or Codex — or paste one CLI line from pinvari.com/connect.
PinVari → Connect → your agent (one click)Get PinVari — $39 →