Accessibility Tree View Chrome: Inspect UI Fast
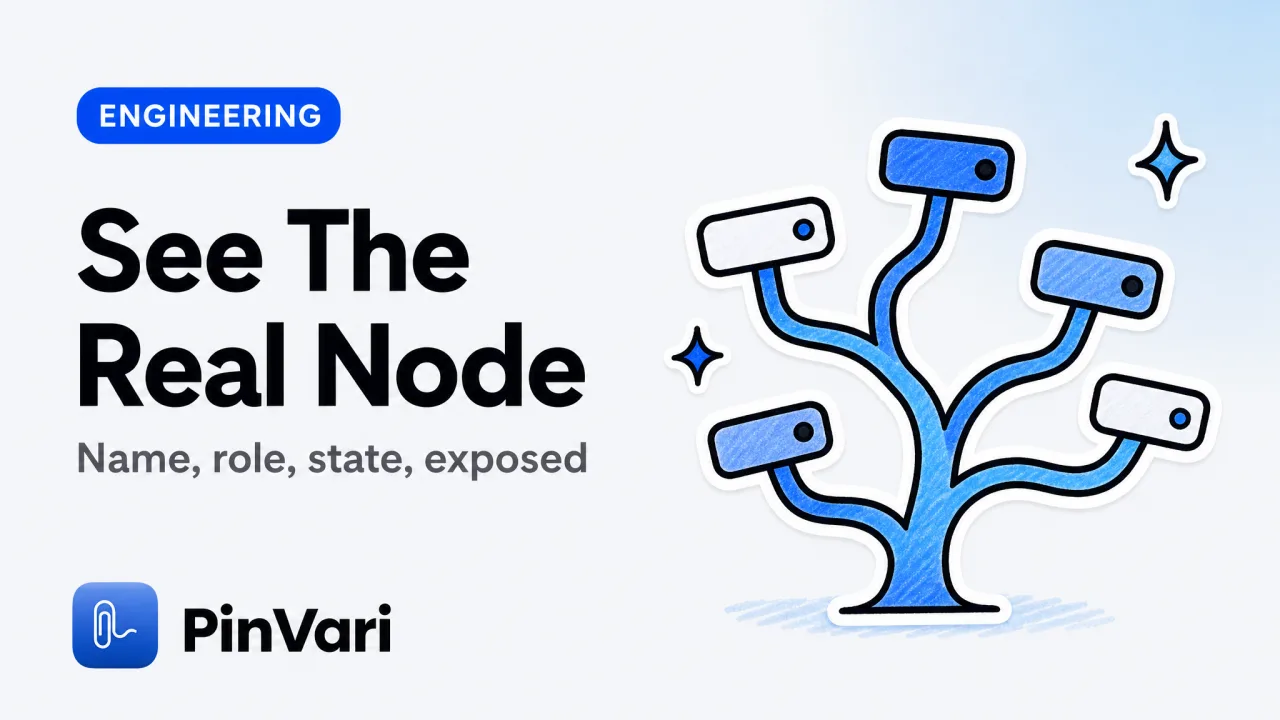
The accessibility tree view Chrome ships in DevTools is the pane that shows a node's computed name, role, and state. Open DevTools, select the Elements panel, and open the Accessibility pane in the sidebar; tick the full-page toggle to see the whole page as a tree.
Chrome computes each node's name, role, and state from the DOM and ARIA. The accessibility tree view in Chrome shows you exactly what a screen reader or an automation tool will read.
Most guides stop at "here is the pane." The part that matters for QA and AI agents is what the tree is for: the machine-readable name of every control.
If you file bugs against a web app, that name is the difference between "the blue button" and a node you can act on.
A screenshot shows pixels. The tree shows button "Submit Order" with its state.
How do you open the accessibility tree view in Chrome?
Open the accessibility tree view in Chrome in four steps. Each one takes seconds once you know where the pane hides.
- Open DevTools with Cmd+Option+I (or right-click any element and choose Inspect).
- Select the Elements panel, then find the Accessibility tab in the right-hand sidebar. If it is hidden, click the
>>overflow chevron. - Click any node in the DOM to see its computed Name, Role, and ancestor chain.
- Tick Enable full-page accessibility tree at the top of the pane, reload, and browse as a tree.
There is a second, lower-level route. Navigate to chrome://accessibility for a raw dump of the tree for every open tab.
This page is verbose. It is the ground truth when the DevTools pane looks incomplete.
Use Cmd+Shift+C to activate the inspect cursor, then hover any control on the page. DevTools highlights the element and jumps the Accessibility pane to its computed name and role.
The accessibility tree is not the DOM. It is a filtered layer the browser builds for assistive technology, so an HTML element can be absent from the tree if it is hidden or has aria-hidden set.
What does each accessibility tree node show?
Each node shows a computed name, a role, a set of states, and the source of that name. Those four properties are what a screen reader announces and what an automation locator matches against.
The name is computed by the accessible name algorithm. It walks aria-labelledby, then aria-label, then a native label or text content, then title or placeholder.
The computed name, not the visible text, is what assistive tech reads. That is why a button showing an icon with no label reads as an empty node.
The role tells the receiver what kind of control it is: button, textbox, checkbox, link. The state captures runtime facts like disabled, expanded, checked, or focused.
The source panel in Chrome shows which attribute produced the name. You can see whether a name came from an aria-label or leaked in from surrounding text.
When a bug is "the control does nothing," check the node's role and state before you check the JavaScript. A button that reads disabled in the accessibility tree is behaving as coded; the bug is in the state logic.
Reading nodes in Chrome maps almost one to one onto reading them on macOS. If you know how to use the Accessibility Inspector, the columns are the same: role, title, value, and a parent chain.
Accessibility tree in Chrome vs the macOS AX tree
Chrome's accessibility tree and the macOS AX tree describe the same idea in two vocabularies. Chrome speaks ARIA roles; macOS speaks AX roles, and the browser bridges them so the OS can expose web content to native assistive tech.
The accessibility tree view Chrome ships in DevTools is the web-facing side of that bridge. The Accessibility Inspector on Mac is the native side.
How you inspect it
- Chrome: Elements panel, Accessibility tab
- macOS AX: Accessibility Inspector (Xcode)
Scope
- Chrome: One tab's web content
- macOS AX: Every app, native and web
Name field
- Chrome: Computed name (accname)
- macOS AX:
AXTitle/AXValue
Role field
- Chrome: ARIA role (
button,textbox) - macOS AX:
AXRole(AXButton,AXTextField)
Element at a point
- Chrome: Inspect cursor
- macOS AX:
AXUIElementCopyElementAtPosition
Web content bridge
- Chrome: Native to the browser
- macOS AX: Exposed as
AXWebArea
Lazy tree gotcha
- Chrome: Rebuilds on reload
- macOS AX: Set
AXManualAccessibility, retry ~150ms
The bridge is where the two meet. Chrome exposes its page to macOS as an AXWebArea, so a native tool asking "what element is under this point" gets a real answer inside a browser window.
That is also what the macOS Accessibility API is used for beyond screen readers. Any tool can query the named element under the pointer.
Two gotchas trip people up. Chromium builds its AX tree lazily, so a native tool often has to set AXManualAccessibility and retry for about 150ms until labeled nodes appear.
When a point lands on a bare AXGroup, a well-built tool descends to the deepest labeled child. It can use AXDOMIdentifier and AXDOMClassList to name a title-less node.
Why does the accessibility tree matter for bug reports and agents?
The accessibility tree turns "the thing on screen" into a named, structured target that a human or an AI agent can act on without a clarifying question. A report that says button "Submit Order" (disabled) is executable.
A report that says "the button doesn't work" is a conversation.
Once you can read a node's role, name, and state, you stop writing bug reports in pixels. You start writing them in nouns the codebase already uses.
The same node names show up in your ARIA attributes, your test locators, and your component props. A report anchored to them points at the source.
For AI coding agents, this is the whole game. How AI agents know which UI element you mean depends on whether you hand them a resolved node or a picture.
Feed an agent the role, computed name, and frame, and it can look up the label in the source. Feed it a PNG, and it has to OCR and guess.
This is why a capture tool built on the accessibility tree beats one built on pixels. On macOS you can hold ⌥⌘A, point at any control, and speak the issue.
The tool resolves the element via the same tree you just inspected in Chrome, attaches a confidence score, and files a named target. When AX is genuinely empty, on a canvas or a WebGL surface, it falls back to on-device OCR rather than pretending it resolved a node.
For QA engineers who want named reports without opening DevTools every time, PinVari resolves the element you point at for a one-time $39, on-device, with nothing uploaded by default.
FAQ
How do I view the accessibility tree in Chrome?
Open DevTools with Cmd+Option+I, select the Elements panel, and open the Accessibility tab in the sidebar. Click any node to see its computed name, role, and state, or tick "Enable full-page accessibility tree" to browse the whole page as a tree.
What is the difference between the DOM and the accessibility tree?
The DOM is the full HTML structure; the accessibility tree is a filtered, computed layer built from it for assistive technology. Hidden elements or nodes with aria-hidden exist in the DOM but are absent from the accessibility tree, so the two are never identical.
Why is a node's accessible name empty in Chrome?
The accessible name is computed from aria-labelledby, aria-label, a native label, or text content, in that order. An icon-only button with none of those reads as an empty node, which is a real accessibility bug that a screen reader would announce as nothing.
How do I inspect the accessibility tree on macOS instead of Chrome?
Use the Accessibility Inspector that ships with Xcode. It shows the AX role, title, value, and parent chain for any app, native or browser, and lets you inspect the element under the pointer, mirroring what Chrome's DevTools pane shows for web content.
Can automation tools read the accessibility tree?
Yes. Screen readers, test frameworks like Playwright, and native capture tools all read the accessibility tree rather than pixels. That is why role and computed name are more reliable locators than CSS position, since they stay stable when the layout shifts.
Does the accessibility tree work inside Electron apps?
Yes, because Electron embeds Chromium, which builds an accessibility tree. The catch is that Chromium builds it lazily, so a tool inspecting an Electron window may need to force the tree with AXManualAccessibility and retry before labeled nodes appear.
Hand your agent the exact element
PinVari resolves what you point at into a named, executable instruction — on-device, no keys, your own agent. One click inside PinVari connects Claude Code, Cursor, VS Code or Codex — or paste one CLI line from pinvari.com/connect.
PinVari → Connect → your agent (one click)Get PinVari — $39 →